Personal Portfolio for Digital Marketing

Category: Digital Marketing Assignments

Juxta Luggage Marketing Campaign Performance Report: Year Two

A Quick Overview and Review of Year One

In the first year of acting as the marketing manager for Buhi’s Juxta Smart Luggage, we saw growth and areas of improvement. If you would like to read the in depth dive into those year one results, please click here.

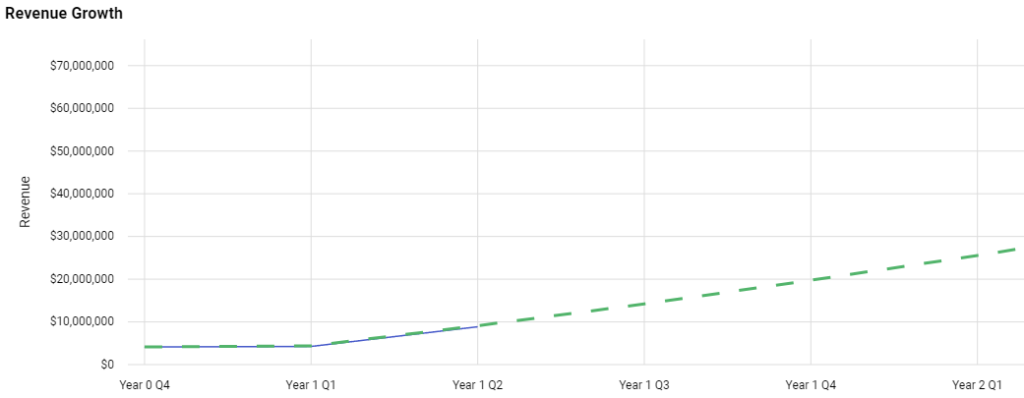
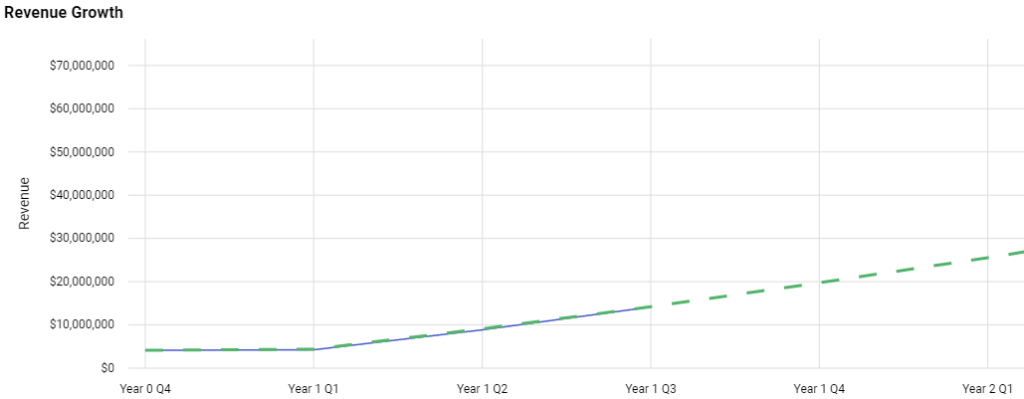
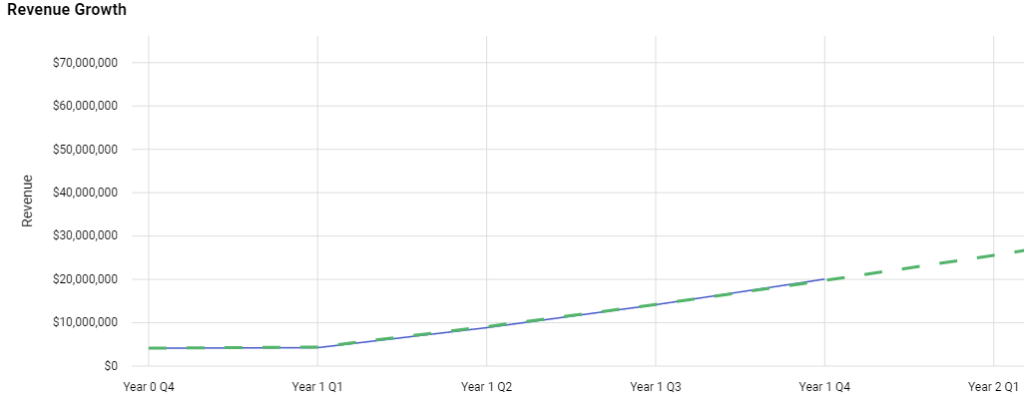
Within the first year we saw an overall improvement to the sales performance of the Juxta Smart Luggage line. At the end of Q4 of Year One, not only were we on track to exceed the goal of a 60% increase to sales, we were on track to exceed it. Q4 sales had grown 12% over Q3 and this trend showed no signs of slowing.

We had set goals beyond the initial 60% in light of this increase and to serve as a refresher as we begin this deep dive quarter by quarter, here is a reminder of those extra goals we had been aiming for:

  • Percentage increase of 1.06%
  • Revenue goal of $47,500,000
  • Increase share of Loyalty stage customers

Quarterly Results

Quarter One
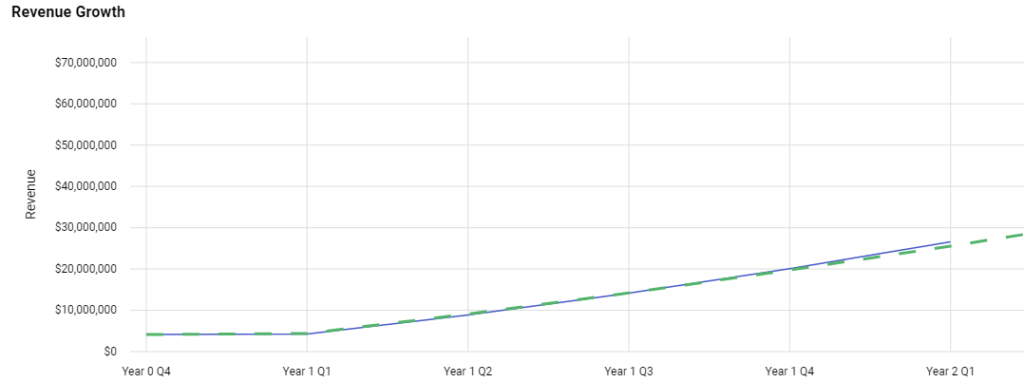
Year Two Quarter One Results
  • Sales Goal: $25,550,000
  • Results: $26,554,371
  • Variance: +$1,004,371
  • Compared to Q4 of Year One: +10%

Starting the second year off right might be a bit of a brag, but we have proven in this quarter that it was at least a worthy one. Exceeded sales goals and the previous strong holiday season of year one Q4 performance set year two up on the right foot.

Overall, the greatest increase within the marketing funnel snapshot lies within Consideration/Intent. As anticipated in the previous report, Awareness/Intent plateaued and we did see a slight increase in Purchase as well as a steady baseline continuation for Loyalty.

Out of the personas, we received the most website visits from Sue with an 8% increase in Consideration/Intent. Community Relations performed the best when comparing the CPC for each website visit.

For the others:

  • Mindy
    • 8% growth in Consideration/Intent
    • Best CPC: Flyers
      • Honorable mentions for Magazines and Direct Mail
  • Raj
    • No growth in Loyalty
    • Best CPC: SMS and Social Media
  • Sally
    • No growth in Loyalty
    • Best CPC: Mobile Marketing
      • Honorable mention to Podcasts

Quarter Two
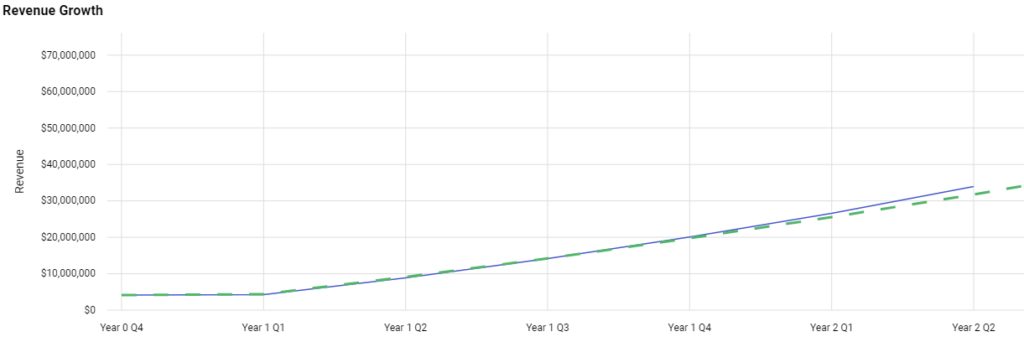
Year Two Quarter Two Results
  • Sales Goal: $31,750,000
  • Results: $33,956,822
  • Variance: +$2,206,822
  • Compared to Q1: +14%

Following the current trend, this quarter also out performed expectations. This quarter helped to cement the self-established goal of $47,500,00 for the campaign.

This quarter saw a slight increase in two of the marketing funnel stages, those being Awareness/Intent and Consideration/Intent.

The persona that generated the most websites visits was Mindy, with a 10% increase in Purchase. Ebooks performed the best CPC wise, with Social Media and SMS Texts coming in as the runner ups.

For the others:

  • Sue
    • No growth in Loyalty
    • Best CPC: Email Marketing
      • Honorable Mentions: SMS Texts and Mobile Marketing
  • Raj
    • 7% growth in Consideration/Intent
    • Best CPC: Video and Flyers
      • Honorable Mentions: Billboards and Flyers
  • Sally
    • 11% growth in Awareness/Intent
    • Best CPC: Community Relations

Quarter Three

Year Two Quarter Three Results
  • Sales Goal: $38,450,000
  • Results: $42,095,821
  • Variance: +$3,645,821
  • Compared to Q2: +10%

This quarter has made it apparent that we were indeed on track to exceed the given sales goal of $45,000,000, and that we were also on track to hit the self-established goal on top of that.

There was another rise in three of the four marketing funnel stages, leaving only Loyalty as the stage that had yet to increase. This funnel stage has remained steady throughout the two years, and a fact I will touch on in the conclusion of this report.

Mindy once again generated the most website visits this quarter, with a 1% increase to Loyalty. For the CPC SMS Texts, Email Marketing, Mobile Marketing and Social Media all proved effective for Mindy.

For the others:

  • Sue
    • 15% growth in Awareness/Intent
    • Best CPC: Blogging
  • Raj
    • 7% growth in Purchase
    • Best CPC: SMS Texts
      • Honorable Mention: eBooks
  • Sally
    • 9% growth in Consideration/Intent
    • Best CPC: Direct Mail

Quarter Four

Year Two Quarter Four Results
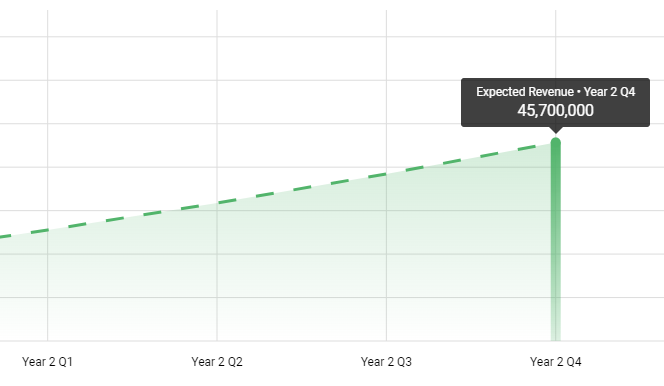
  • Sales Goal: $45,700,000
  • Results: $51,083,825
  • Variance: +$5,383,825
  • Compared to Q3: +10%

Consistency and growth in practice and on paper. Quarter four ends the second year of the Juxta Smart Luggage campaign as strong as predicted, and than some. Consistently growing over each quarter of the year is testament to the campaign’s effectiveness with it’s target audiences.

The marketing funnel saw a continuation of the trends established as well, with growth in all but Loyalty – although that stage did remain consistent at it’s baseline.

For the third quarter in a row, Mindy remained the persona to draw in the most website visits, with a 6% increase to Consideration/Intent. Sponsorships, Billboards and Magazines rose as the best performing CPC.

For the others:

  • Sue
    • 8% growth in Consideration/Intent
    • Best CPC: Video
  • Raj
    • No growth to Loyalty
    • Best CPC: Social Media
  • Sally
    • 8% growth in Purchase
    • Best CPC: SMS Texts and Press Releases

Year Three Projections

  • Revenue Goal: $80,500,000
  • Anticipated Growth: +1.5%

For it’s third year, I anticipated Juxta Smart Luggage will continue to see a boom in growth in sales. We have a well established base of customers that both rely and anticipate our product to deliver on their needs and wants, and what’s better is that going into Year Three, we have a better understanding of how to communicate with those customers. Focusing on honing in on these communication methods will also establish a good ground for ensuring Loyalty remains consistent instead of dipping.

Ad spend controlled and honed, we will have no trouble in hitting that projected goal of $80,500,000, and look forward to hitting $100,000,000 in Year Four.

In Conclusion

As stated in Year One’s report, this campaign had set out to revive the sales of a declining product. The Juxta Smart Luggage was not a product that was in decline for it’s lack in design or features, it simply wasn’t being put in front of the right audiences at the right time.

Last year, we set out to increase the number of customers that entered out Loyalty stage, as this report suggests, increase this stage may not be as important as it will be in the later years (Year Four onward). These last two years have been about reestablishing the customer base for the Juxta Smart Luggage, and as shown by both the numbers and consistency within all stages of the marketing funnel, we have achieved just that. And I anticipate nothing but growth, and an ever growing fan base for the Juxta Smart Luggage, and Buhi Bags, in the future.

Juxta Luggage Marketing Campaign Performance Report

A Quick Overview

For years, Buhi has been a leader in handbags and luggage, catering to customers that aren’t content to sacrifice style for quality, or vice versa. The Juxta Smart Luggage line is one of Buhi’s product lines-and it is it’s time to shine. Featuring a modern and trendy hardshell, multiple on trend colors, and plenty of features that can appeal to the target personas on a personal level and a functional level as well.

For this year, our overall goal was to see an increase in Juxta Luggage sales of 60% in the next two years. Considering the decline that this product has seen recently, it’s also become a personal goal to get back in touch with Juxta’s target personas, and to make the buyer’s journey more intuitive for them.

For the purposes of this report, the sales results will be weighed against expectations per quarter.

Quarterly Results

Quarter One

Sales Results and projections for Q1
Q1 Sales Results
  • Sales Goal: Net gain of $4,400,000
  • Results: $4,245,030
  • Variance: -$154,970
  • Compared to Last Year Q1: 3% Growth

Coming underneath projected revenue by 3.52% Q1 starts off on a surprisingly promising foot. Although beneath projections, the variance is attainable, with projections remaining at a total year one revenue of $45,000,000.

Overall, greatest increase in the marketing funnel snapshot lies within Awareness/Intent.

Out of the personas, we received the most website visits from Sally with a 24% growth in her Awareness/Intent phase of the funnel. Product Placement and Magazines performed the best for Sally when compared to cost per website visit.

For the others:

  • Mindy
    • 10% growth in Consideration/Intent
    • Best performance compared to cost per website visit: Flyers
  • Sue
    • 1% growth in Purchase
    • Best performance compared to cost per website visit: Ebooks
  • Raj
    • 21% growth in Awareness/Intent
    • Best performance compared to cost per website visit: TV, Podcasts and Direct Mail

Quarter Two

Sales Results and projections for Q2
Q2 Sales Results
  • Sales Goal: $9,100,00
  • Results: $8,854,745
  • Variance: -$245,255
  • Compared to Q1: +9%

This quarter also came underneath the projected revenue by 2.7% – closing the gap a bit from the previous quarter and gaining a bit of ground on that $45,000,000 projection. This quarter also out performed Q1 by $364,685.

Awareness/Intent continues to be the greatest increase of marketing funnel growth.

This quarter, the persona that generated the most website visits was Sue, with a 22% increase in Awareness/Intent. Social Media and Product Placement were the top performers when compared to cost per website visit.

For the others:

  • Mindy
    • 4% growth in Purchase
    • Mobile Marketing
  • Raj
    • 10% growth in Consideration/Intent
    • Out of Home Marketing (Airports)
  • Sally
    • 17% growth in Awareness/Intent
    • News Stories, Video Marketing

Quarter Three

sales results and projections for Q3
Q3 Sales Results
  • Sales Goal: $14,200,000
  • Results: $14,149,361
  • Variance: -$50,639
  • Compared to Q2: +15%

This quarter closes the gap between projected sales and actual revenue by the smallest margin, coming in just 0.36% beneath projections. Q3 also outperformed Q2 by $684,902.

This quarter saw a bit of a plateau in terms of projected funnel growth. Awareness/Intent still rose above the others, but Consideration/Intent took a bit of a step up.

This quarter, Sue generated the most website visits once again, with a 10% increase in Consideration/Intent. Sponsorships, Community Relations and Direct Mail proved the best in performing compared to cost per website visit.

For the others:

  • Mindy
    • 17% growth in Awareness/Intent
    • Magazines
  • Raj
    • 8% growth in Purchase
    • Email Marketing
  • Sally
    • 13% growth in Consideration/Intent
    • Community Relations, Out of Home Marketing (Airports)

Quarter Four

Sales Results and projections for Q4
Q4 Sales Results
  • Sales Goal:$19,750,000
  • Actual: $20,058,689
  • Variance: +$308,689
  • Compared to Q3: +12%

Ending Year One on it’s strongest note, Quarter Four is the first quarter where there is a positive variance of 1.56% to the projected sales goal. Q4 outperformed the previous quarter by less than the variance between Q3 and Q2, but still a resounding amount of growth at $614,710.

Quarter four also saw a continuation of the plateau trend for Awareness/Intent in the marketing funnel, with the spike for Consideration/Intent remaining steady on it’s upward climb.

Mindy was the persona that drew in the most website visits, with a 12% increase in Consideration/Intent. Once more seeing Community Relations and Sponsorships performing the best for cost per visit.

For the others:

  • Sue
    • 7% growth in Awareness/Intent
    • Brochures, Magazines, and Video
  • Raj
    • No growth reported
    • Social Media and SMS Texts
  • Sally
    • 6% growth in Purchase
    • SMS Texts

Year Two Projections

Projections for Y2
  • Revenue Goal: $45,000,000
  • Anticipated Growth: +1.02%

Although growth in the first year was slow, I believe on the current trajectory we will continue to see growth for the Juxta Smart Luggage, and should end Year 2 over the expected revenue by the projected $45,700,000. I am setting a personal goal for myself and my team to hit $47,500,000, or an increase of 1.06%.

The plan to attain both the currented projections and our team goal is to zero in on our ad spend, and look to lift the Purchase and Loyalty percentages to increase by 3. I anticipate and projected Awareness and Intent to continue to grow, and follow the pattern of rising in Q1 and 2 and plateau in Q3 and 4.

In Conclusion

This Marketing Campaign was created to drive sales in a declining product line. We have risen to the challenge and have laid the ground work in this first year to meet and exceed projected expectations. In Year 2 the focus will be on harnessing the buying power within our target personas, and drive them to make that purchase and remain loyal to the brand. By ensuring their loyalty, and building it upon the great base of awareness and intent, I believe we’re stepping into a year full of gains and insight into Buhi’s loyal customers.

Lifestyles of the Moderately Wealthy, and Average: A reflection of Consumer Behavior

A rack of clothing.

In the day of Kardashians and social media drenched with glamorous influencers dishing out hefty doses of FOMO, it’s easy for us average consumer to get lost in the lifestyles of the rich and famous. You might ask yourself, “why doesn’t anyone consider what’s going on in my life” or “why can’t I have my own reality TV show”? While I can’t help with the latter, I can assure you that in the former question, marketers strive to keep the lifestyles of the average, every day consumer in mind as they go about their business. In this blog post, I’ll go through why the average person is more interesting to marketers.

Personality is King

If you’re like me (an elder millennial) you grew up through the ‘which Disney Princess are you’ renaissance that happened in the early days of Facebook. As much as those quick personality tests were click bait they were my first steps at understanding myself and my friends. Personality and how people purchase are more related than you might think.

I could go on a pretty long ramble on how psychology and marketing are naturally intertwined, but instead of losing you barely a quarter through this post, I’m going to give you the cliff notes. In short, every product is marketed with a specific individual in mind. Marketers build these buyer personas up on basic psychological principles as well as demographics to not only get a clear picture of who their talking to, but to make the message even more clear to you the consumer.

Marketers build these buyer personas…to not only get a clear picture of who their talking to, but to make the message even more clear to you the consumer.

Think about that click-bait quiz I mentioned in this section. A marketer could look at that result of “Belle” and zoom in on key buzzwords like “introverted, likes to read books, family oriented” and have a pretty good skeleton to build their marketing on. But those are just the building blocks, marketers need to look at lifestyles too, and for that they need to look a little bit deeper into those results.

Lifestyles, Marketers, and You

I think its fairly safe to say that we all life different lifestyles. Even with that in mind, we all still find common ground with others. Maybe your in a “bookworm” group on Facebook, or maybe you are a part of a book club, while your life may differ from other members of that club, you do share commonalities and that is just the sort of information a savvy marketer needs to be two steps ahead of your buying behavior.

Lets think a little bit more about the Belle example and break out some of the main things that Belle likes to do or is known for:

  • She is a Thinker: Always got her nose in a book – but she could also be categorized as a believer!
  • Belle is family oriented and will do anything for her father (and eventually her Prince charming!)
  • Belle is an independent thinker and does her own thing, not what the rest of the town tells her to do.

A marketer that specializes in consumer behavior can look at just those three simple bullet points and already have a good idea of how to appeal to Belle. They can see that Belle won’t be influenced by what those around her have to say, she wants to make the judgement call by herself – and they will make ads that call her to explore the unknown and to learn all that it has to entice her curious mind!

Average is the New Glamorous

As a marketer, one of my favorite things to do is to tell a story. Be it the story of a brand, or the story of the consumer, studying Consumer Behavior and in particular personalities and life styles is that chance to tell a story. Analyzing this aspect of consumer behavior helps the marketer turn advertisements from flashing colors and clickbait articles into genuine conversations about why this product might be right for you. Not to mention, it gives us the consumer, a chance to feel a bit like a VIP when the brand seems to be talking right to you, not waving a bright neon sign in your face.

Analyzing Buhi: A Social Media Report

This report is comprised of analytics and data gathered during the 12 week Social Media Simternship for Buhi Bags. This Social Media campaign focused it’s effort entirely on livening up Buhi’s OG line, and as you’ll see below by the results, was successful at getting this well known product line back in the hearts and minds of customers.

The Target Audience

For this campaign, the target audience I chose to focus on was Daypacker Tom. You can learn more about Tom in this social media audit I performed for Buhi at the beginning of this campaign.

While the audit will give you an in depth glance into Tom’s social media habits, this report does contain updates. In that initial audit I pitched that Facebook, Instagram, and Twitter would be the best channels to target and capture Tom’s interests. What the last twelve weeks have shown is that Tom was best found on Facebook, Instagram, and TikTok.

Not only did we reach Tom on those three main channels, we also reach other potential customers as well. Content that prompted engaging questions, as well as challenges to seek out the adventure social media scrollers were looking for performed the best. Partnering with mega influencer Chris Ronald broadened our reach and revenue and captured that male attention we need to keep Tom engaged. Overall, it’s safe to say that the bulk of our social media engagement is performed by men within Tom’s age and income demographic.

Goals and Metrics

This campaign had the goal of increasing awareness for Buhi’s OG Backpack line through a variety of ways and over the holiday season. We had to find out what worked best with organic and paid posts as well as collaborating with influencers. This presented a wide array of goals and metrics that could be used to measure this campaigns success.

I’ll dive more into KPI’s and metrics below. But first, let’s dive into the content strategy.

Content Goals

For both paid and organic content I wanted the content on all social channels to have an enticing quality. Each piece of content was written with the goal of inviting our followers to daydream about their next big adventure. This was done with a combination of text and breathtaking visuals.

Daypacker Tom is an avid adventurer, and he’s looking for that next big adrenaline fueled experience. This strategy was built around what he would want to see when scrolling through his various social media outlets.

Which Social Media Channel Performed the Best

Instagram was by far the most continually profitable social media channel that we saw throughout these last twelve weeks. With a consistent increase in all areas, Instagram was the reliable channel that we could lean on as a key component of the social media strategy for Buhi.

The KPIs we looked at for these last twelve weeks were based on overall Revenue, Engagement and Impressions.

Data Results for Instagram

  • Total Impressions: 653,804
  • Total Engagement (Likes and Comments): 67,108
  • Total Revenue: $163,960
  • Total Followers Gained: 42,470
A graph showing the total revenue from Instagram.
This graph shows the total revenue earned from Instagram

With a consistent increase in all areas, Instagram was the reliable channel…

Instagram’s consistency became apparent quickly earlier in the rounds, shining as a star in organic posts. Users were drawn to engaging and escapist content, where they could daydream about adventures while potentially looking to Buhi as a brand leader and a next backpack provider. Where Instagram really shined was in the paid social posts – bowling over the other social media channels and rising to the top in terms of both Engagement and Revenue.

Honorable Mentions

Facebook was the third-best channel as far as revenue, but the second best on impressions and engagement. This channel never really rose above the metric of ‘consistent’, but remained as a channel that was worth investing time and budget towards.

Data Results for Facebook

  • Total Impressions: 558,275
  • Total Engagement: 55,748
  • Total Revenue: $61,800
  • Total Page Likes Gained: 33,085
A graph that shows total revenue earned from Facebook.
This graph shows the total revenue earned from Facebook

While it might be easy to look at the numbers earned from TikTok and turn and want to invest more into that channel, I will say that Facebook is worth continuing to use as a social channel for Buhi and for Daypacker Tom. It is a channel that calls for a higher post frequency, and I believe that if that posting frequency seen in the early rounds would have carried through to the end, Facebook would have been in the second spot for revenue instead of TikTok.

TikTok was the second best performing channel in terms of revenue, and had the potential to outpace Facebook in both impressions and engagement. What hindered TikTok in terms of overcoming Facebook lies in age of the average user. As I mentioned in the social media audit at the beginning of this campaign, the younger generation doesn’t share the same outlook as Daypacker Tom – but the numbers show they have the same spirit for adventure.

Data Results for TikTok

  • Total Impressions: 335,745
  • Total Engagement: 34,274
  • Total Revenue: $139,320
  • Total Followers Gained: 19,426
A graph that details the total revenue earned from TikTok
This graph shows the total revenue earned from TikTok

The Underperformer

In the social media audit performed at the start of this campaign, I predicted that Twitter would be a top performing channel due to demographic factors. It quickly became apparent that this was not the case. Twitter as a social media channel is constantly on the move, both in terms of pace of content and types of content posted on the channel. For this reason, I made the call quickly in the campaign to abandon efforts on Twitter to focus on TikTok, and will stand by that position.

Data Results for Twitter

  • Total Impressions: 24,047
  • Total Engagement: 2,582
  • Total Revenue: $7,200

Twitter’s results for Buhi opens up a broader question: Is Twitter worth the hassle?

The short answer is yes, the long answer is maybe.

To get the most out of Twitter you must be able to post multiple times a day, with engaging text posts and occasional media posts. You need to be informative and educational, and the approach we took with Tom during this campaign was to be more alluring, inviting and encouraging to take that extra fork in the road to experience adventure. It wasn’t the right campaign for Twitter.

Is Twitter worth the hassle? The short answer is yes, the long answer is maybe.

In Conclusion…

Overall, my experience working as the Buhi Social Media Manager was a very productive one. It gave me an insight on not just how to handle a large project such as this simternship, but also how to respond and react to the ever changing social landscape. I would say that this experience is extremely valuable to me and my growing career in Digital Marketing.

The biggest thing that helped going into this campaign, in my opinion, was the social media audit. Taking the time to narrow down focus onto the buyer persona was a key player in how I crafted my content and focused on which channels I would post on. It was also the reason why I chose to take such an adaptive response and switch from Twitter to TikTok. Buyer Personas are like sign posts for any social media campaign, the true guiding key markers (along with metrics and data gathered) that helps any social media director/manager to keep focus on the campaign’s goals.

Each round I saw myself looking over the results and course correcting to ensure I was keeping the target audience in mind. If I didn’t do that, I’d be stressing over keeping consistency and frequency high on Twitter instead of adapting to the more profitable channel that TikTok became. I would say that this ability to adapt and react has been the key takeaway for me personally, and I hope it shows throughout this social media report.

My Journey: Tips to Drive Digital Marketing Experience

A hand writing on a piece of paper with a cellphone and computer.
Photo by Firmbee.com on Unsplash

There’s a point in time when we all go through a phase of asking ourselves – am I truly on the right career path? I asked myself that question a year ago, and began my journey down the Digital Marketing path! I started my program with only a basic knowledge of Marketing and what that might entail, so building up my experience with both digital and traditional aspects was a key focus.

The tips you’ll find in this post are from the perspective of someone that sought out Digital Marketing with only a basic understanding and a drive to see myself improve and my career become one filled with a good base of experience and digital marketing knowledge.

Find the Program that Works With Your Prior Experiences

Everyone’s journey is going to be different, and each of us will walk into that classroom (digital or physical) with varying degrees of experience both in our personal and professional lives. That’s why it’s important when you first begin looking for Digital Marketing programs that you look for ones that match your career goals as well as your previous experiences.

For me, I had a basic knowledge of how Marketing worked from a brand ambassador level. I knew that this would help as a good base of experiences to draw on, but knew that I still needed to learn the basics to really build on that skeleton of information I already knew.

Look for “programs” that match your career goals as well as your previous experiences.

Look for programs that will build on what you already know, and also ones that will work with your personal schedule. You won’t learn when you’re constantly stressed for time!! In Digital Marketing terms, look for programs that offer:

  • Market Research
  • Digital Marketing Principles
  • SEO and Analytic Classes
  • Relevant Certifications

This is just the start of what you need to build up a good base of Digital Marketing experience to truly make you feel confident in this new career adventure!

Find an Aspect of Digital Marketing That Draws You In!

Digital Marketing involves so many aspects of Traditional Marketing, with the added flair of having to adapt and stand out within a digital world. From Social Media all the way down to Search Engine Optimization, Digital Marketing experience can be built into either finely tailored angles, or wide-spread nets of broad experiences, this is a field that you can truly tailor to your strengths!

Don’t be afraid to branch out into areas that you wouldn’t normally gravitate to as well! In my case, I thought that content creation would be the strongest skill that I could bring into my Digital Marketing experiences. As I continued on in my schooling, it quickly became clear that I really enjoyed more analytical aspects of Digital Marketing.

Just like all things in life, don’t let your past experiences define your goals. Be flexible, because out of all things, Digital Marketing is a very flexible field. So, adapt and grow and you’ll never know what you’ll find interesting!

Continually Expand on Your Digital Marketing Experience!

The digital world is ever evolving and expanding, from Social Media to AI one thing is for sure; you need to keep learning! Whether you have an established career or are still studying, continual learning is important. Already in my short experience with a career in Digital Marketing I can tell you, flexibility is key.

I always try to stay up to date with industry trends through blogs and YouTube videos from thought leaders within the field. Don’t be afraid to branch out! And don’t be afraid to read up on topics that don’t play into your strengths. If you are more of a Social Media content pro, dive into some of the latest trends on analytics. If you don’t like the rise of AI, still read up on ramifications and potential pros and cons!

The biggest thing to takeaway is to never stop learning. Even if you just graduated and secured that dream job, you should always keep an open mind.

In Summary:

Out of all the things that this post goes through, I hope that it at least gives at least an insight on the steps you might have to take to embark on your own Digital Marketing journey. A career within Digital Marketing means you might have to learn many things, wear many hats, and take many new steps. But I promise you, that once you’ve established a good base of experience within your Digital Marketing journey, you’ll be set!

Social Media Audit for Buhi

A picture of a backpack against a grey background
Photo by Sun Lingyan on Unsplash

Social Media is a tricky thing. With so many different channels to use, how can you determine which one is right? That’s why a social media audit is important for the life of any company, and especially important before embarking on any new marketing campaign. An audit can help any business in understanding their current reach and potential engagements, and how they can utilize the analytics to improve and grow their social media presence.

When looking at Buhi Bags (a company created by Stukent for students to get marketing experience through simulations known as Simternships), this social media audit will extend to one buyer persona. Since this audit is for a simulation, we are unable to really dive into some real-time analytics, but we can still build together a detailed audit based upon the provided resources.

An audit can help any business in understanding their current reach and potential engagements…

Social Media and the Chosen Persona

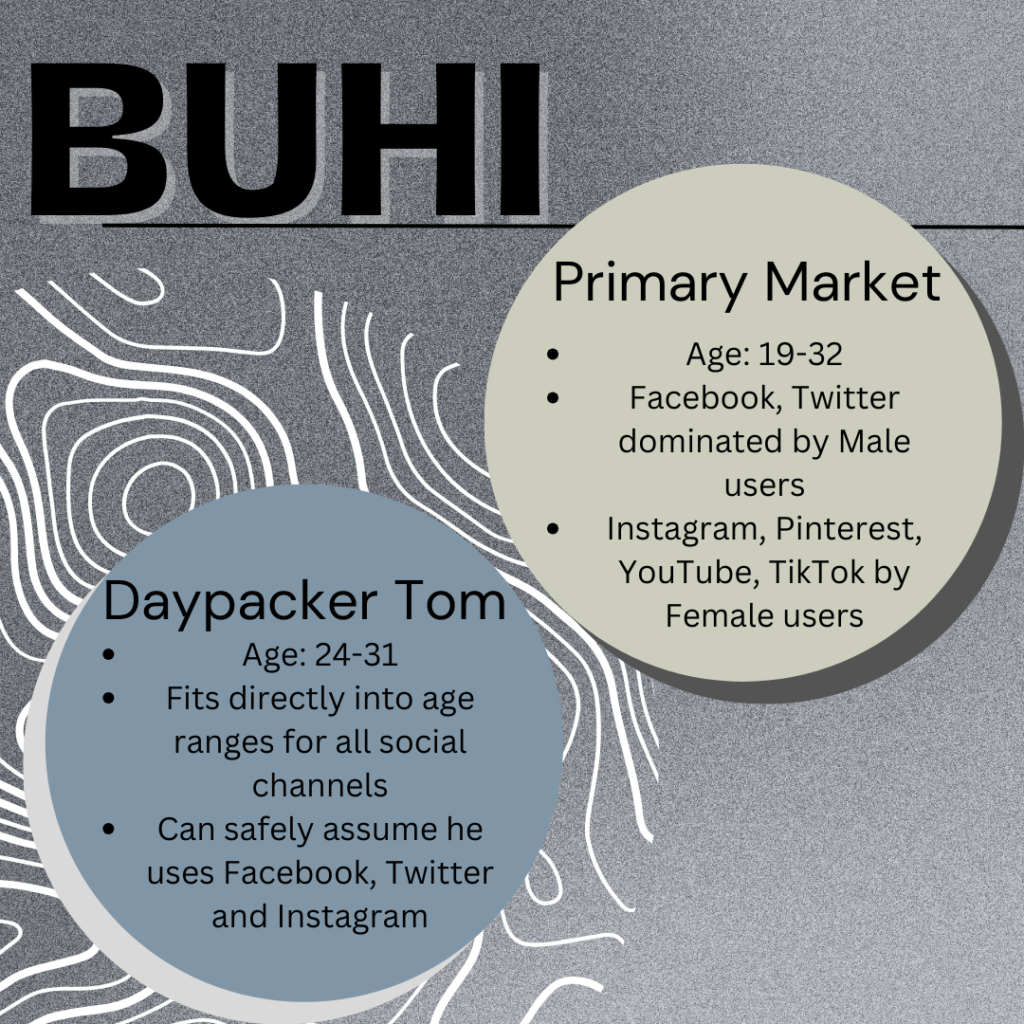
For my social media audit I chose to focus on a buyer persona known as ‘Daypacker Tom’. While this persona does collect the bulk of the market share at 30%, his psychographics align with many of the other persona’s drive to remain active and explore some adventurous possibilities.

Daypacker Tom: Quick Demographics

  • Age: 24-31
  • Gender: Male
  • Income: $25,000 – $35,000

Compared to Buhi’s primary market, Daypacker Tom falls right in the golden zone as far as his age is concerned. Considering that the marketing campaign we are working on focuses in at the OG line (with the price range being $20-$200), his income is also inline with the ideal customer for Buhi’s bags.

An infographic comparing Buhi's social media use of primary market and Daypacker Tom

Tom leads an active lifestyle and enjoys hiking and outdoorsy activities. The product that Tom is most likely to buy is a backpack that can allow him to pack the supplies he needs for a successful trip out on a hike and something he can also use day-to-day.

Key Product Features Daypacker Tom is looking for:

  • Versitle
  • Functional
  • Spacious
  • Styled

Communicating to Daypacker Tom through Social Media

While we can base our content and even tailor our channels based upon what we know about our target demographic, we still need to be aware of what, when and where to post the content. This is where we have to combine what we know about what posts work best for the various social media options we have at our disposal.

Based upon the numbers, the bulk of the success of past Buhi social media campaigns have come from Facebook. With a heavy lead on both Reach and Conversions the only category that Facebook does not outperform the other channels is in Engagement where Instagram stands out as a superior channel for this.

Comparing Daypacker Tom’s demographic to the various statistics available to us from the past Social Media Audit we can see that Facebook is going to be the main channel we can reach him on. As a male, Twitter may also be another channel for us to reach Daypacker Tom with some frequent and slightly less formal social posts. Although, Instagram cannot be counted out, even though it is dominated by female users and should also be focused on.

Daypacker Tom and Facebook

  • Most likely to use Facebook.
  • Checks the app at least once a day.
    • Prime posting times are:
      • Thursdays at 9am, 1pm and 3pm
      • Fridays at 9am, 1pm, and 3pm
      • Saturdays at 1pm and 3pm
  • Posts should be tailored increasing awareness of function and versatility.

Tom, as a hiker, is out to find the most versatile and functional backpack for his needs. Facebook with it’s massive reach presents the best opportunity for both paid and organic posts to spread awareness of what Buhi bags can do both on the trail and in a suburban life. Facebook also presents a great chance to spread awareness of sales and deals and cannot be forgotten about.

Daypacker Tom and Twitter

  • Twitter use is implied heavily based upon demographics.
  • Checks the app at least once a day.
    • Prime posting times are:
      • Wednesdays at 12pm, 3pm, and 5pm
  • Posts should be tailored to building brand awareness and familiarity.

Tom is looking for a brand that’s not afraid to show what they can do. Being able to share a brand voice that is cohesive across all channels will be important to share who Buhi is as a company and what customers can expect from all interactions. Twitter is a great social channel to establish that relationship and to tailor it to an older demographic like that of Daypacker Tom.

Daypacker Tom and Instagram

  • Probably uses Instagram in tandem with Facebook.
  • Checks the app multiple times a day.
    • Prime posting times are:
      • Mondays at 2am and 8am
      • Thursdays at 2am, 8am and 5pm
  • Posts should be tailored to aesthetic images and showcases of the Buhi style.

Tom is looking for a multifunctional backpack that can go where he goes and also a bag that can match his style no matter where he goes. Instagram is the place where aesthetic images showcasing backpacks in the wild, or even in an urban setting can be showcased. Instagram cannot be ignored because of it’s massive engagement returns, so this channel could be used to funnel other users into other social media channels.

Should other Social Media channels be ignored?

The short answer? No.

Certain social media channels are going to be better suited for different demographics. Or, in the case of TikTok, be better suited for a younger demographic that may not share the same associations that would resonate best with an older demographic. It’s also important to remember that if you cannot maintain a consistent posting schedule it is not a good idea to post once and than subsequently abandon a social channel.

Remember that if you cannot maintain a consistent posting schedule it is not a good idea to post once and than subsequently abandon a social channel.

A Few More Thoughts

Social media represents an opportunity to communicate with customers on a personal level. They get to understand Buhi as a company, as a voice, and as a brand leader. Going into posting for social media it’s important to keep that chosen target demographic in mind. Tom wouldn’t respond to posts tailored to a female focused on purchasing bags for her family, or a business professional looking for laptop bags.

It’s also important to remember the other customers and products that Buhi offers. Not everyone is going to be looking for a backpack to go on a hike with, so variety is not a bad idea.

Adding and Formatting a WordPress Post

Add a post

To add a post to your WordPress website, complete the following steps:

  1. Write the post in a Word or Google document. You can do some formatting in that document, but you will not want to copy and paste that formatting into WordPress as it can cause issues in your html coding on the website.
  2. Save the document, run spellcheck AND proofread. Be sure walk away from the document and come back later to proofread again to make sure you find any errors.
  3. Highlight and copy the title in the document.
  4. From your WordPress Dashboard,
    1. Choose Post, Add New
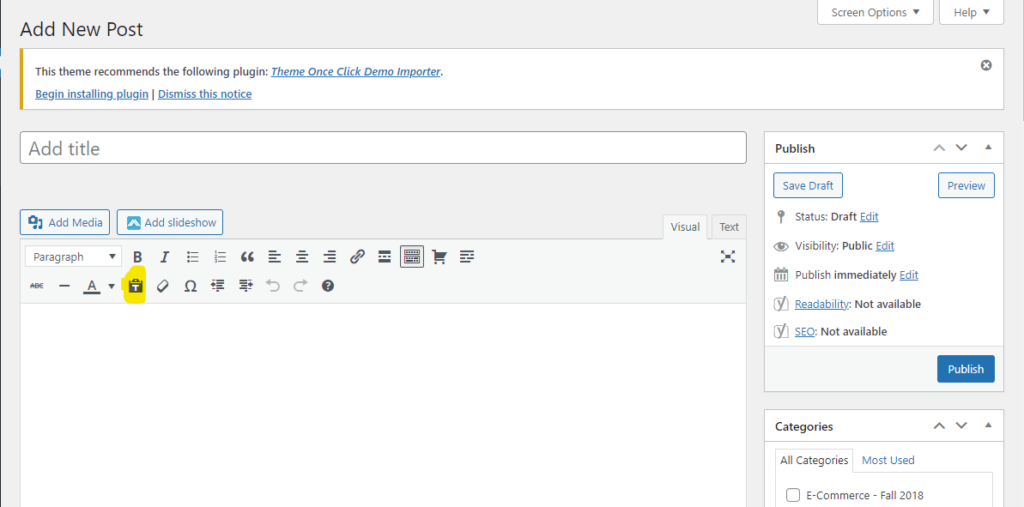
    2. Click on the Paste as Text icon in the toolbar (see screenshot)
    3. Then Paste your content into the main window
A screenshot of how to add text to post as plain text.

Based on the content of your post, choose an appropriate Post Title remembering the importance of keywords and SEO.

The optimal length of a post title is 60 characters

Type or paste your title into the “Add Title” box above the main content window. This will become the name of your post file on your website.

Choose or Create a Category for the Post

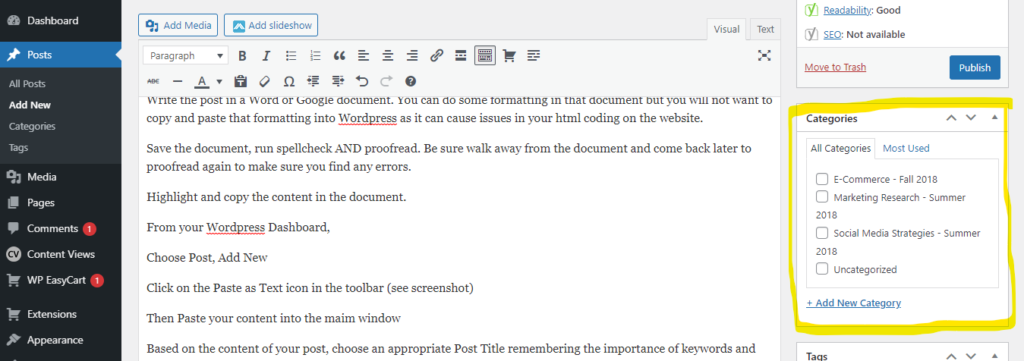
All posts must be filed in a category. You should think about what you plan on posting on your site and determine a few categories. I would suggest creating a category called Digital Marketing Assignments or Marketing Management Assignments depending on your program. (see screenshot)

Screenshot of how to add a post to a category.

If you need to Add New Category, choose that link and create the category. You can create choose to make this a Parent Category or a Child, if it is a subcategory/supporting of another existing category.

If you are writing a post that belongs in an existing category, simply put a checkmark in the box of that category. Posts can be in more than one category.

You will need to highlight and add content in sections based on the type of block you need (i.e. heading/subheading (h2,h3, etc) paragraph, numeric list, bulleted list, etc.)

Formatting a Page or Post

Proper formatting is very important for every page and post on your website. The design principles we learned in Digital Design Components should be reviewed and applied to each page and post on your website. The six principals of design are:

  • Balance arranges the page elements so none of the sections are heavier than the others
  • Proximity or closeness creates a bond between elements on a page
  • Alignment brings order to chaos
  • Repeating design elements and consistent use of type and graphics styles within a web site shows readers where to go and helps them navigate your page
  • Contrast between the text size, text color, background color and pattern to keep text readable
  • White space makes pages more scannable.

Your content is easier to read and understand if it is organized in shorter sentences and paragraphs. If possible, call out important points with bullet points. This makes your content scannable by the reader and they are more apt to review, read and understand it. There are a few tips you can use to format pages and posts making them more inviting to scan/read:

  • Short paragraphs (no longer than 3-4 lines)
  • Subheads every 300 words or so
  • Bullet lists and numbered lists
  • Bolding and italics keywords or phrases
  • Use quotes or “call-out text”
  • Use images, charts, graphs, etc.

In addition to these formatting fundamentals, you should also add strong and relevant imagery.

This does not mean search Google and download the first stock or indexed photos on the list. These photos may “match your search but they could be:

  • Owned by someone,
  • Copyrighted and therefore not legally usable by you
  • They are already being used by someone, somewhere so they are not unique

You want to source specific charts, graphs, screenshots, or high-resolution images that

  • Add value
  • Support and/or clarify your text
  • Draw the reader’s attention

Finally you must confirm that your post looks good on a mobile device as well tablets. Google penalizes non-mobile-friendly sites. Even if your site is found, if it doesn’t look good or function well on a person’s device (mobile, tablet or computer) they will likely.

Optimize for Google/SEO

In addition to formatting for readability, you need to format for searchability. This means making sure each page and post have:

  • Title
  • Subheadings
  • Bullet points
  • Images have Alt Text
  • Links Internal links – linking to other content on your site [paragraph] There are more SEO steps that can be taken after we have our post formatted and published. Once you are content with your post and formatting, click on the Publish button in the upper right-hand corner. We will address SEO in a few weeks.

Powered by WordPress & Theme by Anders Norén